Wednesday, February 25, 2015

Refresher on Lyman Break and It's purpose in Astrophysics

The Lyman Break plays an important part in astronomy.  Generally, it allows us to visualize and analyze the galaxies redshift. However, we must understand what it is!

The Lyman limit ranges from 91 nm to 121.5 nm for the element Hydrogen. It represents the energy needed to eject an electron completely from a hydrogen atom. Any energy (photons) that have a shorter wavelength (higher energy) than 91 nm will be absorbed by the atom. 

In the Universe, the majority of the stars are filled with hydrogen cannot emit light that is much more energetic than the Lyman limit. The Lyman limit is found within the ultraviolet region of the electromagnetic spectrum. This can change due to redshift (which we will discuss later!). 

In the Universe, there are interstellar and intergalactic clouds of neutral hydrogen. When energy emitted carrying photons with longer wavelengths (>91 nm) comes into contact with this neutral hydrogen, a sharp cutoff (or break) in the stellar emission spectrum occurs at 91 nm. The bottom line is that light from normal galaxies has a sharp cutoff at the 91 nm wavelength, when viewed from a great distance.

So, shouldn't every single galaxy viewed from earth have a Lyman break identified at 91 nm? 

No, because redshift changes everything when it comes to light traveling in the constant stretching of "space fabric". Redshift, is the shifting of spectral lines, or stretching of wavelengths into the red part of the spectrum. The higher the redshift, the more these spectral lines have been shifted. 

The Universe is expanding, and everything is moving away from The Milky Way (Except for the nearby Andromeda Galaxy). So, technically everything in space is getting redshifted depending on their closeness to the Milky Way. For example, a nearby galaxy is not moving away from us as fast a galaxy that is far far away. So, the redshift is a cause of the Doppler Effect.


So, going back to the question that should every single spectral source have a Lyman break around 91 nm. The redshift or expansion of the universe causes this Lyman limit and it's break to shift to the red part of the spectrum. So, for example, a galaxy with a redshift of 3 will have it's Lyman break found around a wavelength of 364 nm rather than 91. Another example is that a galaxy with a redshift of 8 will have it's Lyman break around 1000 nm. 

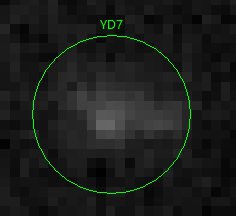
We can use a galaxies Lyman Break to figure out it's redshift, and with it's knowledge of the redshift, we can find out the age of the universe the galaxy was present in. Through the use of filters present on the Hubble Space Telescope, we can see where the galaxy "pops up". So if we can't see the galaxy on a filter that allows wavelengths of 814 nm and below to pass through, but we suddenly see it in a filter that allows wavelengths of 1125 nm and below to pass through, we understand that the galaxy's Lyman break is in between 814 and 1125 nm. So roughly we can guess that the Galaxies redshift is around 7-8.

We can find out the galaxies redshift through the use of the Wavelength-Redshift equation. 

Comparing the actual Lyman limit in the ultraviolet region (without the redshift) 91 nm, we can compare it to the observed wavelength (for this example lets say 969 nm). So it would be 1 + Z = (969 nm / 121 nm). Z, representing redshift, would be around 9.

Using Ned Wright's Cosmological Calculator : http://www.astro.ucla.edu/~wright/CosmoCalc.html , The universe was around 550 million years old when the galaxy was observed. This supports the claim that this galaxy with a redshift of 9, was a early galaxy.


Monday, November 17, 2014

Emission Spectrum and Absorption Spectroscopy

The emission spectrum of a chemical element or chemical compound is the spectrum of frequencies of electromagnetic radiation emitted due to an atom or molecule making a transition from a high energy state to a lower energy state.

For example, when an electron of Hydrogen transitions to a energy level of n = 3 to the base level of n = 2, it emits photons, which can be recorded as the emission spectrum.


Emission is the process by a higher energy particle converts to a lower one through emission of a photon, resulting in the production of light.

The emission spectra is produced when the electrons of the atom are excited and can change it's energy level. This produces a photon.

The emission spectrum allows us to understand the sources chemical composition, temperature, density, mass, distance, luminosity, and relative motion. These spectrum samples consists of absorption lines of celestial objects with emission spectra.

Astronomical spectroscopy is the study of astronomy using the techniques of spectroscopy to measure the spectrum of electromagnetic radiation such as visible light which radiates from stars and galaxies. Astronomical spectroscopy uses Doppler shift measurements as well, to determine a objects age and distance. Spectrum samples are also known to show spread shifts of celestial objects.

Absorption spectroscopy refers to spectroscopic techniques that measure the absorption of radiation. Absorption spectroscopy uses frequency or wavelength as a function. 

Absorption spectroscopy works when a sample absorbs energy (such as photons) from the radiating field and the intensity of the absorption varies as a function of frequency. This variation is the absorption spectrum. 

Absorption lines are Typically classified by the nature of the quantum mechanical change induced in the molecule or atom, 

Absorption spectrum samples are completely different from the emission spectrum, due to the different intensity pattern. Emission spectrum samples


Wednesday, November 12, 2014

Early Universe and Re-ionization

After the Big Bang, the known universe went through many phases or epochs. These epochs were characterized through certain actions that were occurring in the universe. Such actions included light characteristics, atomic and subatomic patterns and actions.


During the creation of the universe, early atoms formed, and the universe consisted of roughly 75% hydrogen and 25% helium. For about a billion years, the gas in the universe was going through two major phase changes. In the first phase change, gas atoms went through combination of electrons and protons to form neutral atoms. This rate of recombination was higher than the re-ionization rate. The Universe continued to become transparent as more electrons and protons combined to form neutral hydrogen. This was known as the dark ages, due to the absence of stars and their emission of light as well as the transparency of the universe. The universe was also dominated by mysterious "dark matter" which is still unable to be fully understood by modern Astrophysicists today. The second phase is when objects started to condense in the early universe, these objects had enough energy to ionize neutral hydrogen. These objects included early stars and galaxies. This is when the Universe went through the re-ionization epoch.


In order to understand the early universe we must understand the basic characteristics of early galaxies. In the beginning of the age of re-ionization, early stars began to mass and clump in clouds of dust, forming protogalactic clouds. In these clouds, gravity caused gas and dust to collapse and form stars. These young stars burned out quickly as gravity continued to collapse the clouds. As the clouds collapsed, they began to form galaxies, as gravity cased other nearby clouds to merge and collide forming larger galaxies. This plays an important part in the evolution of galaxies.


Some question many astrophysicists have is that when and how did re ionization occur? What sources caused re-ionization? What are the first galaxies? These questions also intrigue me, as I plan to look deeper and learn more about the early universe. 

In terms of myself, I really want to know more about the characteristics of these early galaxies, as well as understanding how these early galaxies could have affected the re-ionization of the universe. 

Wednesday, October 1, 2014

Summary of Progress on Sophomore Year


Hello all,

My junior year has already rolled into action, and I thought it would be a good idea to "round up" on what I've accomplished last year as a sophomore, generally summarizing details to put them into a much more organized manner.

I am working with Dr. John Moustakas, a professor a Siena College, NY on the topic of discovering new galaxies. Dr. Moustakas has been collaborating with a team known as CLASH (Cluster Lensing And Supernovae survey with Hubble) and has conducted extensive research on many galaxy clusters. His team just concluded research on Galaxy Cluster Abell 2744 and moved onto researching Galaxy Cluster MACSJ0416-2403.

Galaxy Cluster MACSJ0416-2403
Regarding progress of work from my sophomore year, I was able to analyze galaxy cluster Abell 2744, backed up by Dr. Moustaka's work. A lot of time was spent on understanding the background information regarding the Galaxy Cluster Abell 2744.

The Universe is believed to have been created about 13.7 billion years ago in an event called the Big-Bang. This is supported through the analysis of cosmic microwave background, thermal radiation left over from he Big Bang. Primordial atoms were created (hydrogen, helium) and they eventually clumped together forming stars. After that stars began to clump together to form the earliest galaxies. Eventually these early galaxies collided and merged with others to form the modern galaxies we know today (ie: Milky Way, M101, M64).

In order to understand our galaxies we know today, having a good understanding on the earliest galaxies is a must. These early galaxies are known as Lyman Break Galaxies (LBGs). Before we discuss (LBGs) we must understand the effect of redshift.

Redshift is the "stretching" of wavelengths, making them shift towards the red side of the electromagnetic spectrum. Redshift is caused by the constant expansion of the Universe. For example, an X-Ray stretching it's wavelength to visible light.

Notice how the spectrum shifts towards the red part of the spectrum the father the celestial object is from the viewer's location.


 Much of the light we see in space is in the visible part of the spectrum. However since space stretches 13.7 billion light years across (and counting) redshift causes visible light produced from the early galaxies to stretch from the visible part of the spectrum to the infrared part of the spectrum. This affects the early LBGs in great amounts. Because of the Universe's expansion, the redshift in the universe causes distant galaxies (12 billion years or older) to become invisible to visual-light observing instruments.


Another factor that affects LBGs (particularly in massive galaxy clusters) is gravitational lensing. Gravitational lensing is when the gravity that is between galaxies that make up the cluster becomes so strong, it causes light to bend. The light warps, magnifies, and duplicates the background light. Gravitational lensing allows Astronomers to look at light that would be almost impossible to see without the gravitational lens. This allows us to "cheat" and look at much earlier galaxies.

The streaks/smears of light is actually light produced from galaxies behind the Galaxy Cluster. 
Now, Lyman Break Galaxies are galaxies that are star-forming galaxies at high redshift. These galaxies are identified through a technique known as the Lyman-break technique. The Lyman Break technique is a technique used to observe a galaxies Lyman limit. The Lyman limit corresponds to the most energetic photons that can be emitted from hydrogen. The known Lyman limit is around 91 nm, this represents the energy required to remove an electron completely from a hydrogen atom, starting at the lowest energy level. The Lyman break technique is really helpful when it comes to determining the redshift of the galaxy, because it compares the observed wavelength to the emitted wavelength.

Here is the official formula for the wavelength based redshift equation:


For example,
A galaxy with a redshift of 7.2 would have it's wavelength observed at around 10,000 angstroms, due to the expansion of the universe. This causes wavelengths of light to be stretched towards the red end of the electromagnetic spectrum, hence the term "redshift" . However, technically it's real emitted wavelength would be around 1215 angstroms. This data is plugged into the equation to prove that the galaxy's wavelength is around 7.2.

Lyman break galaxies with a high redshift tend to not appear in the visual filter. This is due to the lightwavelengths  emitted from galaxies to be shifted into the infrared sectiopn of the electromagnetic spectrum. This is caused by the expansion of the universe. The Lyman break helps represent when the galaxy becomes observable, as the galaxy is observed under mulptiple filters based on designated wavelengths. For example, the Hubble Space telescope observes these Galaxy clusters under many different filters which range from wavelengths of 814 microns (visual) to 1600 (infrared).


More to Come!

Wednesday, June 4, 2014

Continuity of Work, and Gazing Towards the Future

On June 5th, at 7:00 pm at the Burnt Hills High School, I will be present at the symposium to present my poster based on the summary of my work so far. Many of my details come from other blog posts. Data collection from the SAOImage ds9 program as well as references from Dr. Moustakas's paper Young Galaxy Candidates in the Hubble Frontier Fields. I. Abell 2744.

I will be continuing my research on Lyman Break galaxies, studying the flux ratio, the brightness of each pixel in different filter (F814W all the way up to F160W), this will further our understanding of these mysterious distant high redshift galaxies. We can do this using a program known as SExtractor.

Hopefully I will be able to create Lyman Break Forests of the galaxy candidates in Abell 2744 as well as other galaxy clusters in the Hubble Frontier Fields Initiative.


Just recently, the Hubble Space Telescope Team unveiled a new image of the deep universe consisting of light from ultraviolet light all the way to near infrared light. this image consists of approximately 10,000 galaxies.

The farther you look back, the farther back in time you are.

Tuesday, May 6, 2014

Making Connections and Analyzing Lyman-Break Galaxies In the Universe

The Big Bang occurred around 13.6 billion years ago. This is supported through the analysis of cosmic microwave background, thermal radiation left over from the Big Bang. Thousands of years after the Big Bang, young stars formed and died, and eventually they grouped up together, forming the first young galaxies. The goal of my project is to discover the first galaxies to form in the 13.6 billion year old history of the Universe. Most of the data of my project is collected from the Hubble Frontier Field initiative, a current program that is analyzing galaxy clusters and their gravitational lensing. A gravitational lens is when gravity causes light to bend and warp. Due to the sheer gravitational force found within galaxy clusters, it causes light emitted from other galaxies to warp, bend, and magnify itself. This allows Hubble to "cheat" in a sort of way. Since the light from distant galaxies is too dim for Hubble and it's advanced instruments, gravitational lensing allows us to see these distant galaxies since the light is magnified. These distant galaxies are aged around 13 billions years or even older. 


Gravitational Lensing can be easily observed in Galaxy Cluster MACS J1206.2-0847. The streak-like figures of light can be easily visualized through the intense gravitational effects of the gravity within the Galaxy Cluster due to the immense amounts of dark matter.


We can select these galaxies through the use of filters and the Lyman Break Technique. Filters allow us to block and pass through levels of the electromagnetic spectrum. We use the photometric system called the Johnson-Morgan system, developed in 1953. This system uses a number of filters, U for ultra violet, B, for blue light, V, for visual light, G, for green, R for red, And I for infrared. Within the infrared filter, there are many sub categories, ranging from near infrared to far infrared. The galaxies I am analyzing can be found in the Y filter. Regarding galaxies being found in the Y filter, it means that the Lyman-Break occurs in the Y filter, or the galaxy is a Y "dropout". The Lyman-Break technique is a technique used to discover the age of the galaxy by analyzing the hydrogen atom. A Lyman-break is a term used to describe the action of a electron (on any energy level) ionizing and retreating to the first energy level. We can find the galaxies age by using the redshift equation ( Z + 1 = (Observed Lyman-Break/ Rest Frame)). A normal hydrogen Lyman break is found within the wavelengths of 912 Angstroms to 1215 Angstroms. However in space, due to the expansion of the universe, the Lyman break will be shifted towards the longer wavelengths of the electromagnetic spectrum. For example, a galaxy with a redshift of 7 will have it's Lyman-Break observed at around 10000 Angstroms rather than 1215. In other commonly used astronomical units, the observed Lyman Break would be at 1 micron rather than .1215 microns, or in nanometers; the observed Lyman-Break would be at 1000 nanometers rather than 121.5 nanometers. 

Lyman-Break Forests of YD4, YD9, ZD6, and ZD9

Equation used to find the redshift of Lyman-Break Galaxies


Now, for example, if the Lyman-Break would occur at 10000 angstroms, we would not be able to see the galaxy in the visible part of the spectrum, however, this galaxy (which is supposed to be seen in the visible part of the spectrum) is so far away, that it's emitted light is red shifted all the way into the near infrared section of the electromagnetic spectrum. In this project, I can visualize and see when the galaxy "pops" up.


Lyman-Break Galaxy YD7 can be observed by comparing the area inside the designated YD7 Circle. Above, is the image of YD7 in a filter known as F814W, a filter allowing visible light in while it blocks out the infrared light. Below, is the image of YD7 in a filter known as F160W. This filter allows longer wavelengths, mostly infrared light in as well as some of the visible light spectrum. The whole point of comparing the images is that if YD7 was nearby, it's Lyman-Break would in the visible part of the spectrum. But it is missing from the visible filter. However we see it appear in the near infrared part of the spectrm. This is because of the expansion of the universe, it causes the Lyman-Break to be shifted towards the longer part of the spectrum.


Thursday, April 24, 2014

Abell 2744 and it's Y Dropout Galaxies Shown Through Different Filters

I am sorry I have not been updating my blog lately, I have been caught up with other tasks. However, I have been able to save a image of galaxy cluster Abell 2744 including it's distant galaxies. The reason that the distant galaxies are named YD is because the galaxies are so distant and dim, that the wavelengths we receive are literally dropping out of the Y passband on the\electromagnetic spectrum. This is because since the Universe is expanding, it causes the wavelengths to stretch along with the "fabric" of space. This causes the wavelengths we receive from these galaxies to become redshifted.
Galaxy Cluster Abell 2744 in the F160W filter 


Galaxy Cluster Abell 2744 in the F814 filter

One of the coolest things is that these distant galaxies are so distant, that they only appear in the near-infrared wavelength filter, or the F160W. This filter only allows wavelengths at 1.4 to 1.7 Microns to pass through. These wavelengths are found within the near infrared section of the electromagnetic spectrum. F814W however, is a filter allowing wavelengths of .7 to 1.0 Microns to pass through. These wavelengths are found within the optical section of the electromagnetic spectrum.

These distant galaxies are known as Lyman-break galaxies, or LBGs. Lyman-break galaxies are star-forming galaxies at high redshift (Abell 2744 has LBGs at 7 and greater). These galaxies are chosen through a technique called the Lyman-break technique. The Lyman-break technique is used by observing a galaxy's Lyman limit. This represents the energy required to remove an electron completely from a hydrogen atom, starting from it's lowest energy level. Since galaxies consist of a lot of stars, and stars consist mostly of hydrogen gas, it would be appropriate to study and observe the hydrogen atom (simply because there is an abundance of hydrogen in the universe). Because of the photons emitted from the stars within the galaxies, these photons can ionize neutral hydrogen atoms and will be absorbed by interstellar and/or intergalactic clouds of hydrogen. Any photon more energetic than the Lyman limit (912 - 1215 Angstroms) is most likely to be absorbed quickly by a hydrogen atom, because it can completely eject the only electron. This is represented by the sharp break.
Lyman Breaks (straight vertical lines)  can be seen around 1.0 Microns 
A regular galaxy will have it's Lyman break at the 912-1215 angstroms. However, a galaxy such as YD9 with a red shift of 8.1 would have it's Lyman break red shifted all the way into 1.0 Microns rather than having it around 912 - 1215 Angstroms. The only way to observe these galaxies are through observing them through different filters. The Lyman-break can literally be seen through shifting through the F814W and the F160W. This is so, because the wavelengths are so redshifted, no photons can be observed through the regular optical filters. Filters that allow the near infrared will allow the redshifted wavelengths to pass through. 
(Above) YD1 can be barely seen through the F160W filter
(Below) YD1 cannot be seen through the F814W filter. This is so because the Lyman Break is so redshifted, that it is in the near infrared part of the electromagnetic spectrum


(Above) YD9 is clearly shown in the F160W filter, while it is barely observable in the F814W filter (Below)


My biggest question as of right now, is how do Astronomers simply "pick" these distant Galaxies? Do they just know that these are good candidates for LBGs? Or is there much more of a process to finding these LBGs?

More soon!